2024’s Renewable Energy Boom: Did the World Move Fast Enough?
Renewable Energy and the Global Shift
Renewable energy has become the cornerstone of global decarbonization efforts. From solar and wind to geothermal and bioenergy, these technologies are reshaping electricity, heating, and transportation systems. It reduces emissions, enhancing energy security, and creating a decentralized, resilient energy economy that supports sustainable industrial and economic growth.Why Reports and Verified Data Matter
Tracking renewable energy progress requires more than headlines. It demands transparent, verifiable data. Accurate statistics and independent reports are critical for measuring actual deployment, identifying trends, and evaluating policy performance. They empower engineers, planners, and decision-makers with the tools to invest wisely and accelerate the energy transition effectively.REN21’s Essential Role in the Energy Sector
REN21, the Renewable Energy Policy Network for the 21st Century, is one of the world’s most trusted sources for renewable energy insights. Its annual Global Status Report (GSR) compiles real-world data from governments, industries, and civil society. It provides a neutral, on-the-ground perspective on renewable energy development and policy performance.Why ECAICO Uses REN21’s GSR 2024
In this article, ECAICO references data from REN21’s Global Status Report 2024 to explore the main renewable energy statistics and trends mentioned in the report. This data-driven approach helps professionals understand where real deployment is happening, which technologies are leading, and how policies are translating into measurable impact across different energy sectors.Key Global Statistics from GSR 2025 (Calendar Year 2024)
1. Unprecedented Capacity Expansion
In 2024, the world added a record 741 GW of renewable power capacity. 18% year-over-year growth that marking the largest annual increase on record.2. Solar PV Led The Surge
Solar photovoltaic installations delivered 602 GW, making up 81% of all new capacity. Wind added another 117 GW, while hydropower, bioenergy, geothermal, and CSP remained minor contributors.3. Regional Disparities
China drove the bulk of growth by 60% (~445 GW). The G7 countries added roughly 92 GW, North America ~56 GW, while Africa and the Middle East contributed only ~13 GW combined.4. Investment & Generation Trends
Global investment in renewables rose to USD 728 billion in 2024 (+8%), but investment growth lagged the surge in capacity. Renewables-powered generation climbed by 10%, doubling 2023’s increase.5. Tripling Goal Still Far Off
Despite record installations, REN21 warns the world is still about 800 GW short of the pace needed to achieve the COP28 tripling target by 2030.6. Emissions & Temperature Trends
Despite this momentum, global CO₂ emissions rose by 0.8% in 2024. The year also marked a grim climate milestone: it was the hottest year on record, with average global temperatures exceeding 1.5°C above pre-industrial levels — for the entire calendar year. |
| CO₂ emissions and average temperature rise from 2021 to 2024. |
Between 2021 and 2024, global CO₂ emissions rose from 36.4 to 37.8 gigatonnes, while the global temperature anomaly increased from 1.17°C to 1.55°C. This clear upward trend illustrates the correlation between rising emissions and global warming. (Data sources: Global Carbon Budget 2023 (Global Carbon Project) and Copernicus Climate Change Service – ERA5).
7. Investment Snapshot
Global investment in renewable energy and enabling tech reached a record USD 2.1 trillion, a 13% increase, though growth in core renewable energy investment slowed to +8% (USD 728 billion). Solar PV attracted 72% of all renewable investment, with a 22% growth year-on-year.8. Electricity & Final Energy Mix
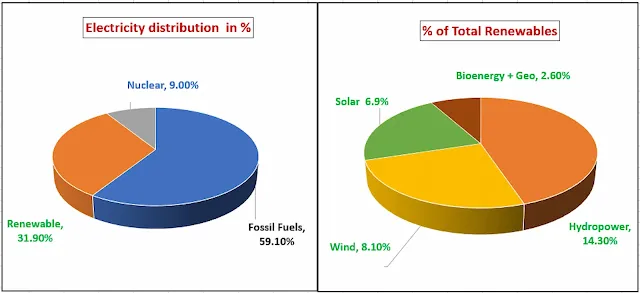
Electricity needed rose 4.3% globally in 2024. Renewables supplied 31.9% of global electricity, while fossil fuels still dominated at 59.1%. Hydropower remained the largest source at 14.3%, but solar and wind showed rapid gains. However, only 23% of total final energy consumption (TFEC) is electrified with heat and transport lagging far behind in renewable uptake. |
| 2024 global electricity mix |
The first pie chart illustrates the global electricity generation mix for the year 2024. Total generation reached approximately 30.9 thousand terawatt-hours (TWh), setting a new record. Fossil fuels remained dominant, supplying 59.1% (18.2 thousand TWh) of total electricity, although their share continues to decline. Renewables accounted for 31.9% of the total, while nuclear power contributed the remaining 9%. This distribution reflects the ongoing transition but also highlights the persistent reliance on carbon-intensive sources.
9. Transport and Storage Progress
- Electric Vehicle (HEV) sales hit 17 million units, a new global record.
- Battery energy storage grew rapidly, with 69 GW deployed, totaling 150 GW globally.
- The average cost of battery storage dropped by 33% to USD 104/MWh, driven by oversupply.
10. Policy Landscape & Targets
- 89 countries had renewable energy targets; 64 had both renewable and net-zero targets.
- 53 countries had carbon pricing; 44 had emission trading systems.
- 6 countries aimed for 100% renewables.
- The EU admitted it was falling short of its 2030 target, with only 24.5% renewable share in 2023.
11. Power Purchase Agreements (PPAs)
PPAs hit a record: 69 GW of renewable power contracted through corporate PPAs with a 35% increase. Tech giants like Amazon, Google, and Microsoft signed major deals, with the US leading in volume.12. Remaining Challenges
Despite progress, the world is far from meeting the 2030 tripling goal. To hit the 11,000 GW target, annual additions must jump to 1,040 GW/year from 2025–2030 with 40% more than in 2024. Other headwinds included:- Fossil fuel subsidies
- Permitting delays and grid bottlenecks
- Investment constraints in developing regions
- Overconcentration in solar/wind and major economies
